

To our IKE Customers and Community, Like all businesses, we are continuing to monitor and respond to COVID-19. Our focus at IKE is on the health and well-being of our people, their families, andRead More
If you have ever had a great day fielding poles you have experienced the mental bliss that comes from a successful day in the field. This joy, while not often acknowledged, is what truly drivesRead More


Your time is important to us. We will be following up with you soon.
Until then, here are some resources you might find useful:
Sincerely,
Team IKE
Telephone, Email, Morse Code, or Smoke Signal
 303-222-3218
  [email protected]
1-720-381-1634
[email protected]
7 August 2019

Geographic Technologies Group (GTG), an Esri Partner Network Gold member, is a full-service local government GIS consulting company with over 20 years of experience, 600 local government clients in the US and Canada, and the recipient of multiple Esri partner awards. GIS Analysts with GTG collaborate closely with their local government clients to improve organizational GIS structure, design efficient data models, and deploy Esri solutions and applications.
Jonathan Welker, a Senior GIS Analyst with GTG, has been working collaboratively with the City of Roswell, Georgia on their GIS Strategic Plan and implementation. The Strategic Plan was developed three years ago in collaboration with Patrick Baber, GISP – the GIS Manager with the City of Roswell. The plan was laid out with yearly goals in mind, with years one and two focused on the migration to Esri software and designing the framework and foundation for their GIS operations, including internal solutions and public applications.
Now in the third year of the plan, Welker and Baber wanted to go above and beyond the basic functionality established with the traditional suite of Esri tools, and have a goal of creating a 3D interactive Historic District with geometrically accurate buildings. According to Welker, Esri has been expanding their 3D capabilities. These recent enhancements led to the project leveraging ArcGIS Pro for the design of the 3D Historic District.
Welker and Baber believe that a 3D environment opens the door to a new means of visualization, and keeps the City of Roswell on the cutting edge. One of the biggest selling points for the City of Roswell was the future use of the 3D environment during town meetings, so officials can visualize a building and location without having to go on site. Also, supplemental data can be pulled into this environment for additional insight beyond the 3D structures.
According to Baber, “Roswell’s Historic District is the focal point of the City. With high demand for location, and strong feelings both for and against change, development within the Historic District is frequently a topic of discussion for Roswell’s government. A dynamic 3D environment will be an invaluable tool to visualize existing buildings, tree covers, and other assets within the District, as well as conceptualize any proposed future development.”
To create the map and establish the geometry, Welker needed to collect building heights and footprints. “We started with a LiDAR point cloud, which generally provides returns from laser pulses onboard aircrafts to give a detailed record of the earth’s surface and features. That was combined with building footprints to give us the initial building geometry.”
As Welker started working on the buildings in ArcGIS Pro, he realized that some of the structures had measurements that were significantly inaccurate due to dated LiDAR data, or oddly shaped roof segments. “Many of these buildings are obscured by tree canopies that led to misleading LiDAR data and structure heights,” explains Welker. As a result, he needed to go on site to verify certain buildings and collect accurate data.
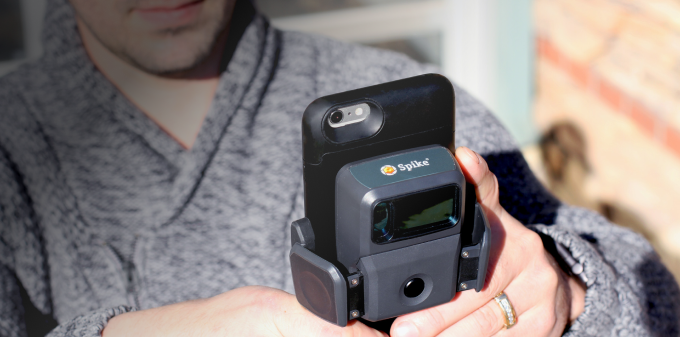
The question that he was then faced with was, what is the most efficient way to go validate building and roof heights to rectify the incorrect measurements? This was a unique problem that GTG had never been faced with before. Thankfully, a colleague had heard of Spike during an Esri User Conference and recommended that Welker check it out for his 3D project. Spike is a smart laser measurement solution, and the recipient of the 2019 Esri Partner Conference Award for Improving Field Operations. Welker quickly acquired a couple of Spike units in late summer 2018, and paired the devices with iPad Airs.
In preparation for the field work, Welker symbolized an ArcGIS Online web map to indicate which buildings looked correct and which buildings looked to be way off. He then used Collector for ArcGIS to indicate and view color-coded buildings that needed to be verified. Each building was given a unique building ID in Collector.
He loaded the Collector app and Spike app onto the iPad Airs with the Spike device mounted onto the back, and went into the field with Baber for two days to test the mobile setup and the measurements captured with Spike.
Welker used Spike to capture photos, and measure building and eave heights. “Then I could go back into ArcGIS Pro, find that associated building, and add the accurate roof type, roof height, eave height, and geometry,” says Welker.
With a tried and true method now in place, Welker sent a field technician out for one week to collect the remaining buildings that needed to be verified. The technician was instructed to spend as little time in the field as possible, so he focused on going from building to building quickly capturing photos with Spike. At the hotel each evening, the technician uploaded the photos to the Spike Cloud. Welker was then able to take all the measurements he needed by logging into the Spike Cloud from his browser, and measuring building and eave heights. He felt that using the Spike Cloud to take measurements made him more efficient, and minimized field time.
Between the field technician and Welker, they were able to capture 364 buildings in the field with Spike in 7 days. Training the technician on how to use Spike was a quick and easy process, according to Welker. “I happened to be on site at our headquarters, so I spent 30 minutes with the technician outside, took a few photos of buildings, and that was it. He was good to go.”
Welker is appreciative that his colleague introduced him to Spike. “I was at a loss at what do, and there wasn’t a good answer. Spike was definitely the best option, which is why we went with it. We received building plans for City Hall, but obviously we couldn’t get plans for every building in the Historic District. We could have eye-balled the buildings or tried a free app, but those were very unappealing alternatives with shaky results.”
From Baber’s perspective, “the Spike device was a simple and inexpensive method to augment older, less accurate LiDAR data with the information necessary to create the 3D shapes for the project. We are excited to deploy the 3D environment, and the Spike devices and collection methods are essential to the success of the project.”
Welker is currently in the process of finalizing the 3D Historic District environment. As part of his plan, he will publish a 3D web scene via ArcGIS Pro, which essentially is a 3D version of a web map and is browser-based. Welker believes that there is a lot of functionality in the web scene that could be leveraged by the City of Roswell. For example, via the web scene you can change the visualization of the buildings, and leverage additional fields tied to the buildings. Additional fields he envisions adding are zoning, type of roof form, when the building was built, if the building is in a flood plain, and if the building is in development. Eventually, Welker and Baber plan on rolling out the 3D environment to the public.
When asked if he would recommend Spike to other GIS analysts, Welker says “ I’d absolutely recommend Spike. For a project like this, Spike did everything we wanted it to do and was definitely far better than what we would have been able to do with our eyes. It was easy to use, and met our accuracy needs for correcting the building measurements.”
As for involving Spike in future projects, Welker has a few ideas. To enhance projects like the 3D interactive historic map, Welker believes he could attach the Spike photo to the building in ArcGIS Pro, so you can see what the building looked like at the time of inventory. He also believes that GTG would benefit from using Spike in other projects, such as measuring assets like light poles and trees for their GreenCityGIS initiative.

For Ryan Cain, YESCO branch manager of the St. George, Utah office, conducting site surveys for signage work was traditionally an expensive process, … Continue reading "Spike Stories: How Geographic Technologies Group Used Spike to Verify LiDAR Data for 3D Historic District Environment"
Celebrating six years of ISA Membership, seven years serving the sign and graphics industry, and over 50,000Spike users worldwide! Get the most valuable … Continue reading "Spike Stories: How Geographic Technologies Group Used Spike to Verify LiDAR Data for 3D Historic District Environment"


Copyright © 2026 | ikeGPS.COM - All Rights Reserved.


 Connect
 Call
Call Support
 sign in
 IKE Value
  Meet our Team